In some quick changes I swapped/enabled a few things:
- Removing Remark42 for Native Comments
- Removing Nurui “Custom Search” for Official Search
- Adding Portal for user sign ups.
Otherwise, things are the same - the hosting/nginx/theme/etc.
Which I love the features I’ve enabled, but I’ve lost my 98 on Insights/Lighthouse and my Search Console report has quite drastically changed towards the negative.
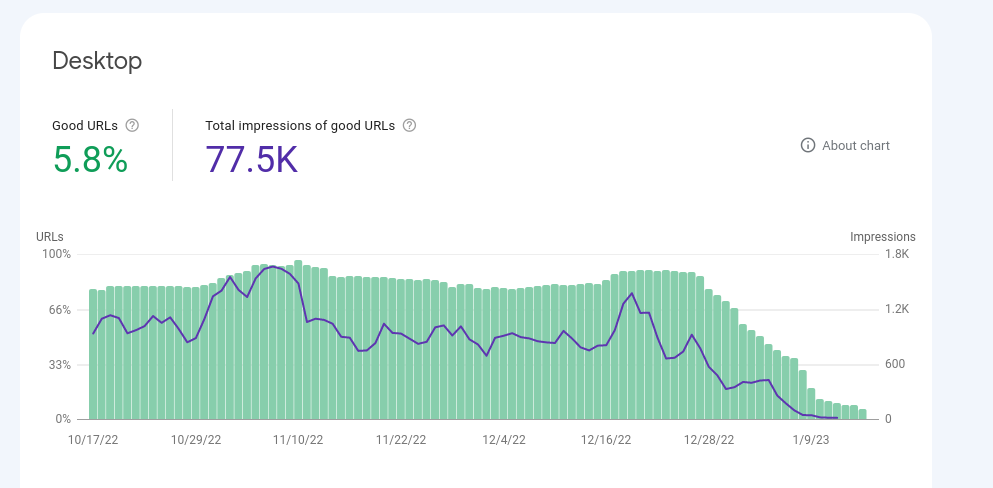
So I set out to see what has been causing this and the top contributors to the change seem to be:
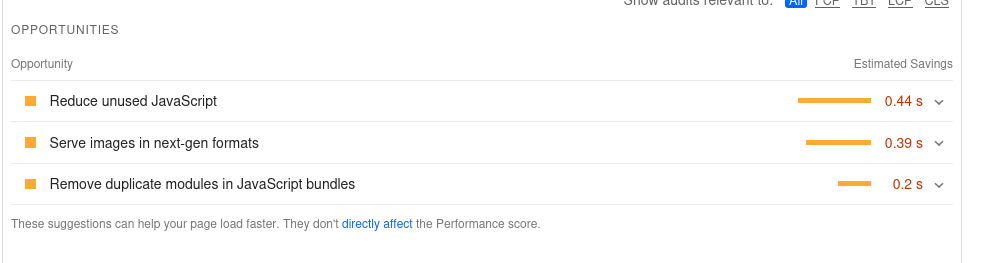
-
Unused JS doesn’t seem exactly valid - I do use Portal/Search/Comments, but the index home page may interpret that differently. For comments there are no comments on homepage, but there are comment counts.
-
Next-gen formats refers to WebP and I don’t care about that.
-
Remove duplicate modules is referring to
react-dombeing part of all 3 large dependencies (portal/search/comments)
So if we look at the 3 dependencies I added via enabling those features - the impact is quite large in pale to what I previously had.
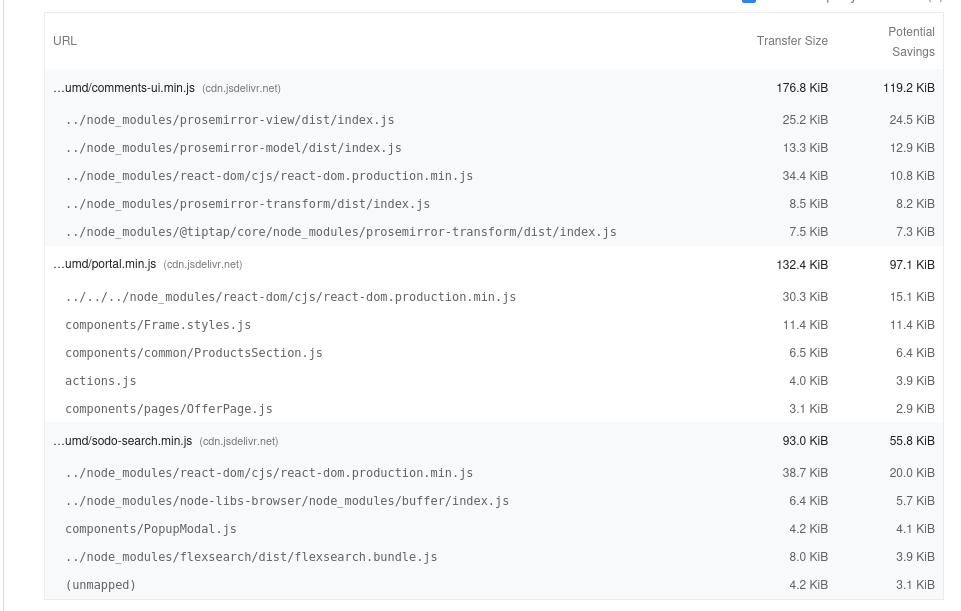
So you can see the below stats for compressed transfer size - some of these unpack to at least a meg.
- comments (comments-ui) - 176.8kb
- portal - 132.4kb
- search (sodo-search) - 93.kb
Compared to existing on my theme:
- index - 18.82kb
- global - 338 bytes
- custom - 3.12kb
- ityped - 3.19kb
So 401kb vs 24kb, so I’m seeing roughly a 1670% increase in transfered JS for these added features. Perhaps that’s perfectly okay given the feature set, but lets continue on in some research.
If we look at duplicate dependencies that Portal/Search/Comments use we can find:
- react-dom - 3x (30kb~ each)
- babel/runtime - 3x (2kb~ each)
- react - 3x (1kb~ each)
So honestly they are all weak in size except for react-dom, but are duplicated due to the common packages between them.
However, my blog homepage is a huge collection of images that I try my best to optimize, so maybe I’m chasing the wrong thing. So I’m torn between a few things:
- Asking Ghost to support inline JS packages, so I can unify dependencies, harden CSP rules at the cost of losing instant updates to those packages.
- Re-doing featured images for webp/optimized/something.
- Re-examining my theme (Nurui) to see if its at fault.
- Disabling Portal/Search/Comments
Anyone have any 2c’s to add if I’m chasing the wrong thing?
If you want to peek: https://connortumbleson.com for your own research.
